Membership Reports
These reports are designed to summarize athlete's performance in a straightforward and easy to understand format. Reports provide you with the most valuable information to better monitor your Swimmer’s performance, development, and easy way to recognize your Swimmer's strongest events and pin point the areas of a potential concern. It will help you to validate the progress and identify the trends. No more pencil tracking!
1. Performance Overview
This table summarizes your performance and lists all your times for each event.
| Event | Date | Meet | Gender | Age | LSC | Club | Time |
|---|---|---|---|---|---|---|---|
| 50 Freestyle SCY | 9/18/2010 | 2010 AZ SAC&–WSF | M | 9 | UN | UN | 58.32 |
| 11/12/2010 | 2010 AZ Fall FASTival | M | 9 | UN | UN | 55.32 | |
| 100 Freestyle SCY | 11/12/2010 | 2010 AZ Fall FASTival | M | 9 | UN | UN | 2:12.32 |
| 12/11/2010 | 2010 AZ WReg Suppl | M | 9 | UN | UN | 1:57.84 | |
| 1/28/2011 | 2011 AZ SAC Winter Inv | M | 9 | UN | UN | 1:51.13 | |
| 200 Freestyle SCY | 11/12/2010 | 2010 AZ Fall FASTival | M | 9 | UN | UN | 3:27.97 |
| 12/20/2010 | 2010 AZ AGE Eastern Reg | M | 9 | UN | UN | 3:18.12 | |
| 1/28/2011 | 2011 AZ SAC Winter Inv | M | 9 | UN | UN | 2:53.09 | |
| 2/25/2011 | 2011 AZ Age Group Reg | M | 9 | UN | UN | 2:47.47 | |
| 3/10/2011 | 2011 AZ SC Age State | M | 9 | UN | UN | 2:56.49 | |
| 500 Freestyle SCY | 11/12/2010 | 2010 AZ Fall FASTival | M | 9 | UN | UN | 9:35.42 |
| 1/28/2011 | 2011 AZ SAC Winter Inv | M | 9 | UN | UN | 8:30.45 | |
| 2/25/2011 | 2011 AZ Age Reg | M | 9 | UN | UN | 7:23.72 |
2. Best Time by Event
This table lists your best times for all your events.
| Event | Best Time |
|---|---|
| 50 Free SCY | 42.43 |
| 50 Free LCY | 50.13 |
| 100 Free SCY | 1:42.36 |
| 100 Free LCY | 1:54.88 |
| 200 Free SCY | 3:42.82 |
| 200 Free LCY | 4:24.84 |
| 50 Back SCY | 52.36 |
| 50 Back LCY | 1:05.58 |
| 100 Back SCY | 2:09.70 |
3. Individual meet results
This table summarizes your events and performance results per each meet.
| Meet | Date | Event | Time |
|---|---|---|---|
| 2011 AZ Blue and Gold Meet | 5/7/2011 | 200 Freestyle LCM | 4:34.64 |
| 2011 AZ Blue and Gold Meet | 5/7/2011 | 100 Freestyle LCM | 2:34.64 |
| 2011 AZ Blue and Gold Meet | 5/7/2011 | 100 Backstroke LCM | 2:07.58 |
| 2011 AZ Blue and Gold Meet | 5/7/2011 | 50 Backstroke LCM | 1:07.58 |
| 2011 AZ Blue and Gold Meet | 5/7/2011 | 100 Breaststroke LCM | 2:27.19 |
| 2011 AZ Blue and Gold Meet | 5/7/2011 | 50 Breaststroke LCM | 1:27.19 |
| 2011 AZ Blue and Gold Meet | 5/7/2011 | 50 Freestyle LCM | 56.13 |
4. Ranking Report
This table provides you Swimmer's overall rankings in a given meet shown by course.
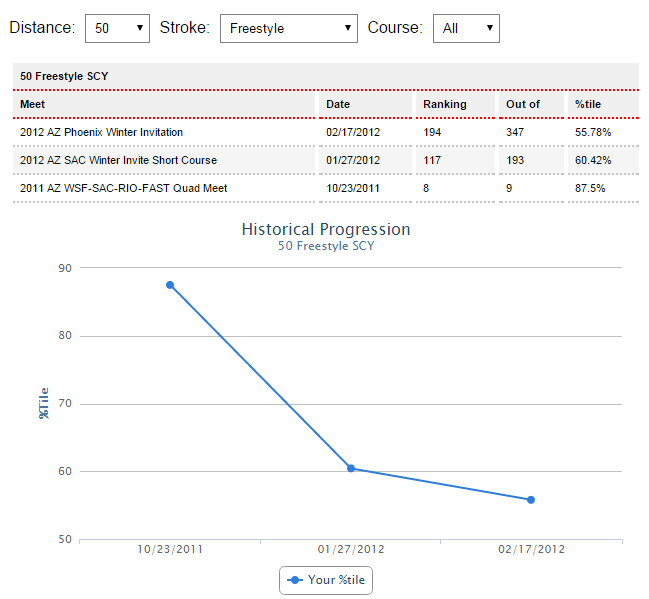
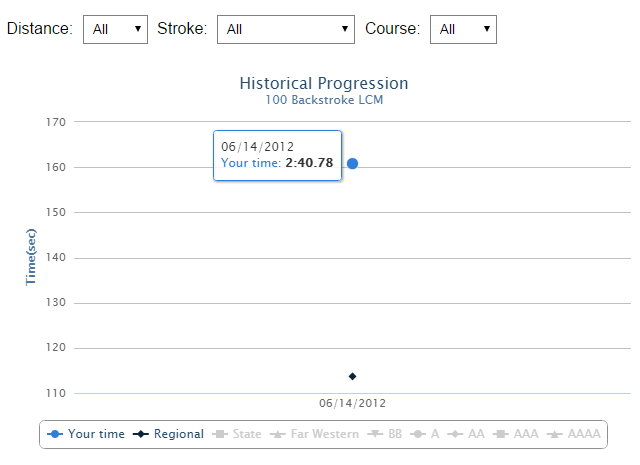
5. Historical Progression
This report represents series of graphs showing your time progression for each event. Mouse over the line points to see your exact time. You can select a cut/standard at the bottom of the graph to see the comparison between your time and other standards. Use side arrows to move to the next graph.
6. Time Deficiency Report
This table lists all events with qualifying time as a benchmark. The qualifying time is yours specific and is determined, based on your age and gender. All qualifying events will be highlighted. Three best non-qualified events also will be listed with the time gap identified.
| Boys 10&Under | ||||
|---|---|---|---|---|
| Meet | Times | R | Gap | Qualified Event |
| 50 Freestyle SCY | 55.32 | 38.89 | 16.43 | |
| 100 Freestyle SCY | 1:51.13 | 1:29.19 | 21.94 | |
| 200 Freestyle SCY | 1:51.13 | 3:9.89 | 200 Freestyle SCY | |
| 500 Freestyle SCY | 5:54.23 | 8:25.79 | 500 Freestyle SCY | |
| 50 Backstroke SCY | 58.08 | 49.19 | 8.89 | |
| 100 Backstroke SCY | 58.32 | 1:42.89 | 100 Backstroke SCY | |
| 50 Breakstroke SCY | 1:25.89 | 53.59 | 32.3 | |
| 100 Breakstroke SCY | 58.32 | 1:55.69 | 100 Breststroke SCY | |
| 50 Butterfly SCY | 55.32 | 47.29 | 8.3 | |
| 100 Butterfly SCY | 2:32.32 | 1:55.19 | 37.13 | |
| 100 IM SCY | 58.32 | 1:41.29 | 100 IM SCY | |
| 200 IM SCY | 5:34.64 | 3:40.89 | 113.75 | |
7. Age Statistics within your team
This table will show your best time for each event, team’s best time for the same event within the same age group, team’s average time, the % title of Swimmers with better performance and the % tile of your performance within your team.
| Age Average Statistics & %tile | |||
|---|---|---|---|
| Boys 8 - 10 | 50 Free SCY | 100 Free SCY | 50 Back SCY |
| Best Result | 28.84 | 1:03.89 | 35.96 |
| Average Time | 48.01 | 1:35.00 | 58:08 |
| Your Best Time | 42.43 | 1:42.36 | 52.36 |
| Better Times Percentile | 31.60% | 40% | 41.20% |
| Your Performance Percentile | 74% | 66.70% | 62.50% |
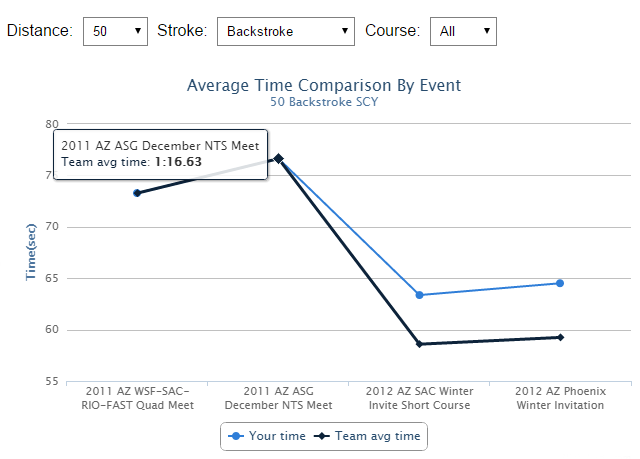
8. Average Time Comparison By Event - Team
These graphs display the comparison of progression of your best time versus average time.
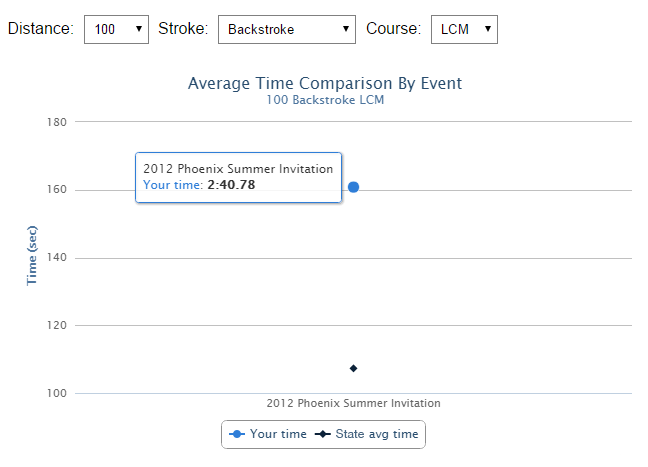
9. Average Time Comparison By Event - State
These graphs display the comparison of progression of your best time versus state average for each event / age group.
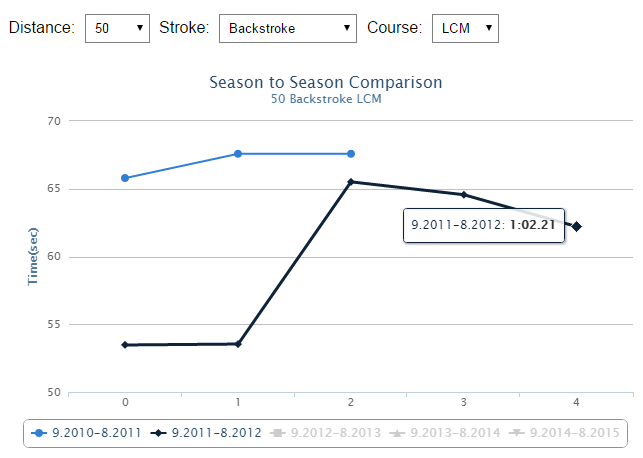
10. Season To Season Comparison
These graphs display the comparison of progression of each event by seasons (for example, short course of previous year vs short course of current year)
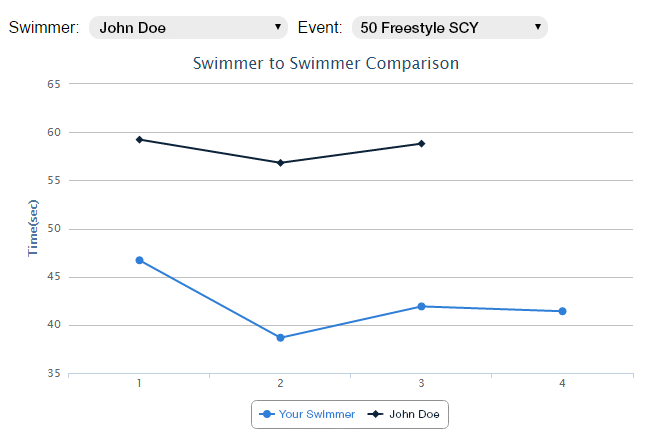
11. Swimmer To Swimmer Comparison
Cool tool. Do you want to know how your Swimmer stacks up against any other given Swimmer? Just pick a Swimmer and an event.